Preparing to atone, Part 2: The story (wonkish -> extremely wonkish)
In 2005-2007 a number of coworkers and I were trying to figure out how much information the S. cerevisiae pheromone response system could transmit. This work was done by a number of terrific people but the lead was Richard Yu (now CEO of the company he founded). The idea was somewhat opportunistic, in the sense that our work up to this point seemingly showed a way we could do this thing. Information theory told us a way to quantify the amount of information a signal carrying channel could transmit might be to determine the mutual information / “Shannon entropy” (Shannon, 1948) between a distribution of inputs that turned on the system (ie, input) and a distribution of some measured downstream response (outputs). If we exposed collections of cells to a specific concentration of ligand, then the value of single cell quantity we choosing to measure would define a distribution outputs. If we exposed cells to a range of concentrations of ligand we were subjecting cells to a distribution of inputs. So in that sense we had in hand both input and output distributions.
To calculate the amount of information the signaling channel could carry, we needed to apply the formula:
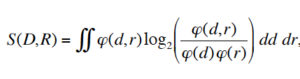
Where (D,R) is the mutual information between upstream dose and downstream response.
Since our experimental data consisted of observed responses to applied doses, we used another form of this double integral appropriate for the distribution of responses conditional on the application of a given dose d, namely φ(r | d) = φ (r, d) | φ (d), so:

For reasons I won’t explain further here, we used limits to the integration, and computed these integrals using Riemann sums.
We also had an expected outcome from such calculations. We had re-learned from our own work and other work (Yi et al. 2003) a truth long known to pharmacologists, which was that in many signaling systems the percent of the downstream response might correspond to the percentage of receptor that was bound by ligand. This idea was in fact central to the elaboration of the idea that drugs bound specific molecules called receptors (Clark, 1933), a phenomenon we had termed dose response alignment. If we interfered with the workings of the signaling system to misalign the downstream response, increasing sensitivity to give great response when little of the receptor was bound, we would increase cell-cell variation in the downstream response, which would be equivalent to decreasing the precision of the system to distinguish different doses, which would be equivalent to decreasing the amount of information the misaligned system could transmit.
So, to do this, we compared the number of doses the system could transmit in cells with dose-response alignment to that of cells with a downstream response that was super-sensitive relative to the receptor-binding curve.
For this, we used cells that lacked SST2, the RGS protein in the system. Δsst2 cells have same receptor-pheromone binding dose response as SST2+ cells 27, but the mutation sensitizes downstream response by over two orders of magnitude 27-31. In Δsst2 cells and in control cells,
and we quantified the signal reaching the transcriptional machinery (i.e., the output of the “pathway subsystem”, P, as we described in Colman-Lerner et al. (2005).
So, in numerous single cells at each dose, we measured the amount of transmitted signal, P. We used P because it is derived from fluorescent reporter gene measurements, which had the lowest experimental error of all our measurement methods, and because this value captured all variation introduced up to the point the signal activates the Ste12 transcription factor. Variation in P has two components, one arising from random differences in the occurrence of probabilistic reactions (“pathway noise”, η2(λ)https://www.ncbi.nlm.nih.gov/pubmed/16170311), and one caused by more stable cell-cell differences, such as the number of proteins that transmit the signal (“pathway capacity”, η2(L)). Because we couldn’t further subdivide variation in P, we considered the measured variation in P (η2(P)) as a upper bound on the amount of stochastic noise in the signal (η2(λ)).
In both strains, we observed beautifully graded responses, with responses unimodally distributed around the mean at all doses. Here was Δsst2
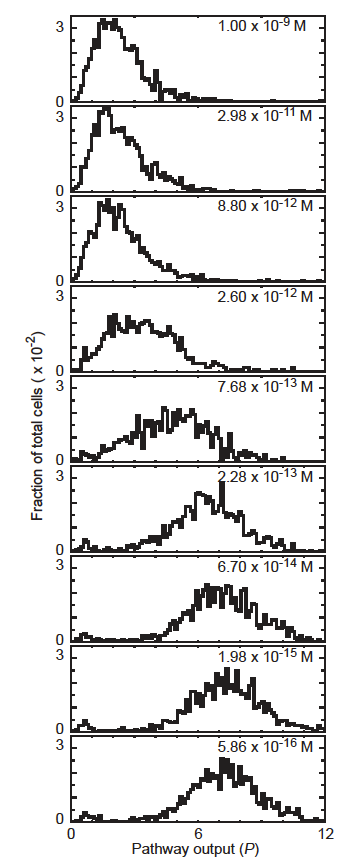
(note that in true supplementary materials style, in this figure, we had top to bottom reversed the doses, so that the dose on the bottommost panel is 10 exp -9 Molar))
As expected, the Δsst2 dose-response curve (below) was more sensitive to pheromone (>3 orders of magnitude reduction in the half maximal response or EC50 (0.64 pM vs. 2.7 nM).
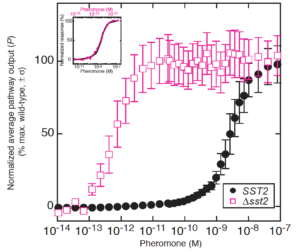
Despite the large shift in EC50, the cooperativity of the Δsst2mutant dose-response was similar to that for the reference SST2+ cells (Figure inset). Thus we concluded that deletion of SST2 altered dose-response alignment primarily by shifting EC50s.
Having shown that, we looked at cell-cell variation in transmitted signal in the Δsst2 strain. In fact, Δsst2 displayed a fuzzier response to ligand (broadened response distributions),
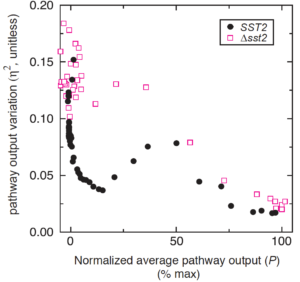
particularly for the lower range of pathway output (<50% of mean output). That is, the sensitizing Δsst2 mutation increased noise in transmitted signal.
So our next move was to quantify how much of a toll misalignment took on the information the system could transmit, by quantifying the maximum number of doses the system could transmit into distinguishable downstream responses (in information theoretical terms, the “channel capacity”). As mentioned, we already had the output distribution in the measured outputs from hundreds of single cells at a given dose. We tried all sorts of reasonable ways to quantify the input distributions, with our favorites being a) to optimize for maximum S(D,R) in the each strain (and SST2+), and to use only distribution that maximized S(D,R) for the reference SST2+ strain. We termed the information computed from these distributions Imax and II.
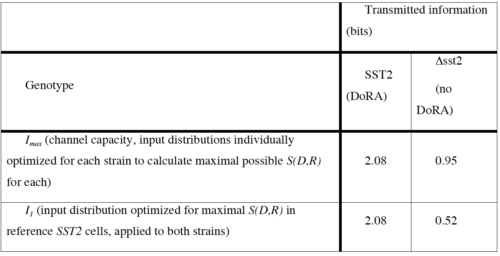
Misalignment caused by the Δsst2 mutation led to a 54% reduction in channel capacity (2.08 bits to 0.95 bits). Hooray. That fit.
Moreover, we had considered and then rejected two possible alternative explanations for the decrease in channel capacity.
One was the fact that system response in Δsst2 cells was saturated at high doses, and the idea that these cells could no longer read a pheromone gradient because cell receptors on the low side of the gradient were just as saturated as those on the high side of a gradient (work by Catherine Jackson and Hartwell in 1990) and there was nice experimental evidence from Jeffrey Segall (1993) consistent with that idea. But, because the channel capacity purports to measure of the maximum amount of information a system can transmit considering all possible inputs, our results showed that cells were not simply transmitting less information due to being stimulated by input concentrations that saturated the downstream response.
We also worried that Δsst2 cells might simply be more variable. But arguing against that was the idea that variation in basal signaling when the system was uninduced (Figure b) was about the same in both strains (η2(P) ~ 0.125). This fact suggested that the effects of deleting Sst2 on variation in P are not due to pleiotropic effects that cause an baseline increase in η2(P) independent of signaling.
Taken together, our results strongly suggested that dose-response misalignment in the mutant was the cause of the reduction in channel capacity.
But then we got cold feet.
References
Clark, A.J. (1933). The mode of action of drugs on cells (Baltimore: The Williams and Wilkins Co.). http://onlinelibrary.wiley.com/doi/10.1002/jps.3080220628/abstract
Jackson, C. L. and Hartwell, L. H. (1990) Courtship in Saccharomyces cerevisiae: an early cell-cell interaction during mating. Mol Cell Biol. 10(5):2202-2213.
Segall, J. E. (1993) Polarization of yeast cells in spatial gradients of alpha mating factor. Proc Natl Acad Sci USA. 90(18):8332-8336.
Shannon, C. A mathematical theory of communication. Bell System Technical Journal 27, 379-423 (1948). math.harvard.edu/~ctm/home/text/others/shannon/entropy/entropy.pdf
Yi, T.M., Kitano, H., and Simon, M.I. (2003) A quantitative characterization of the yeast heterotrimeric G protein cycle. Proc. Natl. Acad. Sci. USA 100, 10764-10769. www.pnas.org/content/100/19/10764